Mapping habitats on our nature reserves

Mapping habitats on our nature reserves

Siân Williams, Senior Monitoring and Research Officer, reports on creating detailed digital maps of the habitats on our nature reserves, and how these maps are being used to tell us more not just about wildlife and biodiversity, but also about carbon storage.

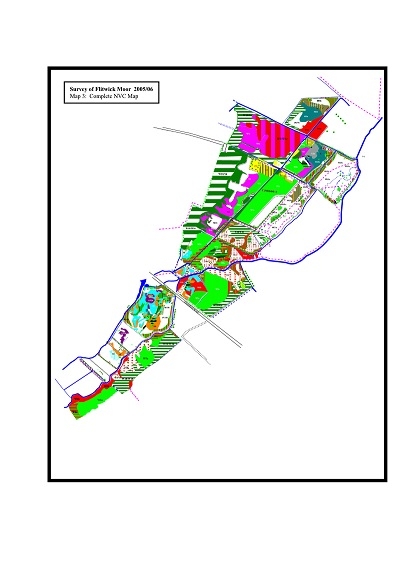
Our nature reserves encompass a wide variety of habitats and plant communities; from the fine-leaved grasses and wildflowers of chalk grassland sites, to reedbeds and other wetlands, and ancient woodlands. Even within a single reserve there can be quite a range. Over the years we have accumulated quite a lot of detailed survey information showing the locations of these habitats. This can be as simple as sketch outlines on a map, or as detailed as a National Vegetation Classification (NVC) survey, which involves identifying plants at a series of sample points and working out which community in a set of defined British plant communities is the closest match.

As well as telling us more about exactly what we have, we can also use information from these surveys for a number of other purposes. By repeating a survey some years later, we can monitor changes and see what effects our management is having. We can also use surveys to help plan management more accurately; for example, if we know exactly how much area a habitat covers, we can get a better idea of things like how much seed we might need to restore a particular area of grassland, or how much time it will take to cut back scrub. Recently, there has also been a lot of discussion about the importance of natural habitats for capturing and storing atmospheric carbon dioxide, as part of combatting climate change. By looking more closely at the habitats we manage, we can work out how much they are contributing to carbon storage and sequestration, alongside their key role in preserving biodiversity.

Most of our existing survey information was stored in various paper reports or scanned maps (like the ones shown above), but with the availability of powerful modern Geographic Information System (GIS) software, it can all be digitised into the same format. Last year, our intern Jake worked out a system for digitising all of our existing habitats maps, including translating different survey types into one consistent system. Having maps in GIS also makes it easier to calculate totals of different habitat areas, and start using those to work out other properties of the habitats as well (such as amounts of carbon stored).

Our Wildlife Trust manages over 4000ha of land on over 100 nature reserves across the three counties. Initial results from the habitat mapping show that the habitats we have the most of are grassland and woodland, with 43% grassland and 24% woodland. The rest is made up of open water and wetland (15%), scrub and heathland (6%), and arable/farmed areas at the Great Fen (10%) and buildings, car parks and other built features (2%).

Pie chart showing breakdown of habitat types on WTBCN nature reserves

In terms of carbon stocks - carbon currently locked up in the vegetation - in these habitats, trees provide the greatest storage, so although woodland is just 24% of the habitats we manage, it accounts for around 90% of carbon currently stored in plants. But this isn’t the whole story. Carbon is also actively sequestered from the atmosphere each year by many of these habitats, and how this happens depends on a number of things including the age of the habitat and how it is managed. Soils, particularly peat, also play an important role in the carbon cycle. Looking at these other more complex factors will be part of the next steps of our habitat mapping project.